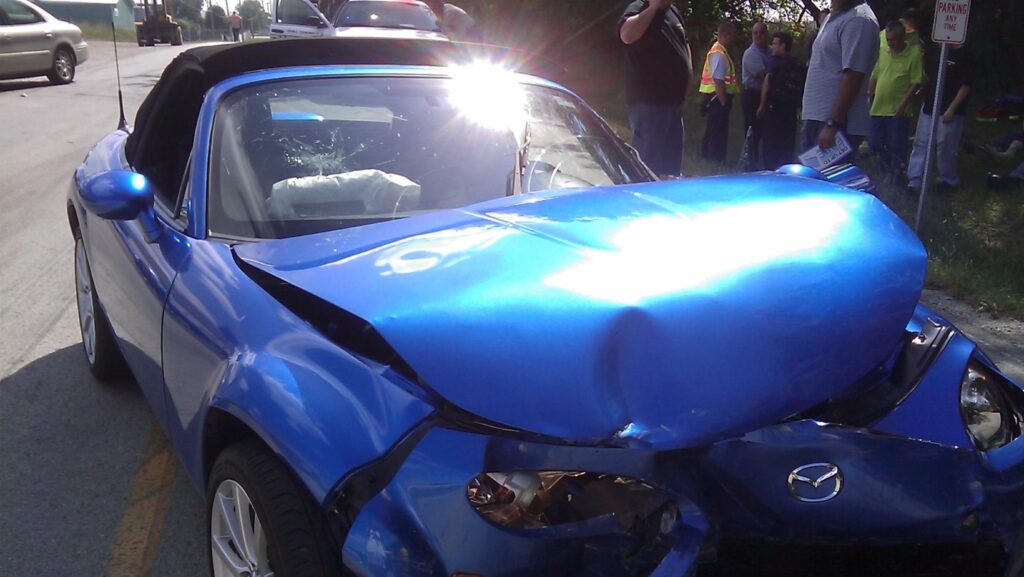
Crash reports don’t show fear. They don’t capture pain or survival or the split second where everything changed. They show numbers. Forty-three accidents in Durham this month. Seventeen involved alcohol. Nine resulted in hospitalizations. The statistics are real, but they’re also incomplete. Each figure represents a person, a family, a moment where someone’s life got derailed by something that took seconds to happen.
Durham’s accident statistics tell the story of behavior and environment and choices, not just bad luck. Seeing the human side of Durham car accident statistics transforms data from abstract numbers into prevention strategies that actually matter.
Statistics become powerful when you understand what they’re actually measuring. A high accident rate in a particular intersection isn’t random. It means something about how that intersection is designed, how drivers behave there, what conditions exist that make crashes more likely. Understanding the patterns beneath the numbers reveals causes, not just consequences.
The people inside those percentages have names and families and futures that got altered. A statistic that says twenty percent of accidents involved speeding encompasses someone who was rushing to the hospital to see a sick parent, someone who was late for work, someone who simply didn’t notice they were going too fast. The statistic is true. The human reality is more complicated.
The Patterns Beneath the Numbers
Speed shows up in accident data constantly. Drivers exceed posted limits. Drivers go too fast for conditions. Drivers treat highways like racetracks. Speed doesn’t just increase the severity of crashes. It increases the likelihood of crashes because faster vehicles are harder to control and give drivers less time to react. When accident statistics show speed as a factor in forty percent of crashes, that number represents choices people made about how fast to go.
Distraction appears in statistics regularly too. Texting while driving. Eating. Passengers. Daydreaming. The driver’s attention divided between the road and something else. Modern life creates endless distractions competing for attention. Statistics showing distraction as a factor in crashes represent moments where something other than driving felt more important or interesting than paying attention.
Time of day patterns appear in accident data. Late night crashes increase. Rush hour accidents spike. Fatigue-related accidents cluster during late afternoon and early morning. These patterns reflect human behavior and biology. People drive tired. People drive impaired late at night. People rush during peak traffic times. The statistics capture the consequences of those choices.
Faces Behind the Figures
Behind the statistic of a young driver in a crash is often a story about inexperience. Young drivers haven’t developed the instinctive reactions that come with practice. They make calculation errors about speed and distance. They take risks that more experienced drivers learned to avoid. The accident statistics capturing young drivers as a high-risk group reflect those developmental realities.
Senior drivers appear in crash statistics too, sometimes at higher rates. The statistics might reflect slower reaction times, vision issues, or medical conditions. But they also reflect that people are driving longer into their lives. Fifty years ago, more seniors had already stopped driving. Today, they drive longer. Some shouldn’t be driving anymore but keep driving anyway because independence feels important.

Repeat offenders appear in statistics as patterns. The same driver arrested for DUI multiple times. The same intersection with chronic safety problems. Patterns reveal systemic issues. A driver with multiple DUIs needs intervention, not another chance. An intersection with repeated crashes needs redesign, not more warning signs.
Turning Data Into Action
Awareness campaigns use accident statistics to change behavior. Campaigns about drunk driving, distracted driving, speeding, and fatigue cite statistics to make risks feel real. The number of people who die in drunk driving accidents per year becomes emotional when you realize that’s families destroyed. Statistics gain power when they’re connected to stories.
Safer street design comes from understanding accident statistics. If an intersection has ten times more accidents than similar intersections, engineers investigate why. They look at sight lines, traffic patterns, signal timing, and road design. They identify what’s making that intersection dangerous. Then they fix it. Statistics identify problems. Design changes address them.
Police enforcement focuses on high-risk areas. Where accident statistics are highest, police increase patrols. Where speed is a factor, they focus on speed enforcement. Where distraction is common, they target phone use. Enforcement gets deployed based on where data shows problems are most serious. The statistics guide resource allocation.
Data With Purpose
Statistics don’t save lives by themselves. Raw numbers are just information. Statistics matter when they get translated into action. Awareness that comes from seeing statistics. Safer design based on patterns. Enforcement targeted at high-risk behaviors and locations. Individual decisions to drive more carefully because you understand the risks. That’s how data transforms into prevention.
Every person in Durham driving safely today creates an accident statistic that didn’t happen. Every person making better choices about speed, distraction, and impairment prevented themselves from becoming part of next month’s report. The statistics reflect past behavior and current reality. What matters is what people do with that information going forward.


